Las Vegas has always been a top destination for domestic and international tourists.
But have you ever wondered how many people visit Vegas? Or if the city is still as popular as it used to be?
In this report, you’ll discover the latest stats and how the data compares to before the pandemic.
I’ve also gathered as much 2025 information as possible to give you a better picture of tourism trends. Rest assured, you’ll find all the most up-to-date research here.
Let’s get into the numbers!
Table of Contents[Hide][Show]
Visitors To Las Vegas Per Year
In 2024, 41,676,300 people visited Las Vegas, representing a 2.07% rise over 2023.
2025 is on track to fall behind 2024 numbers, with 1,536,500 less travelers from January to June compared to the same period last year.
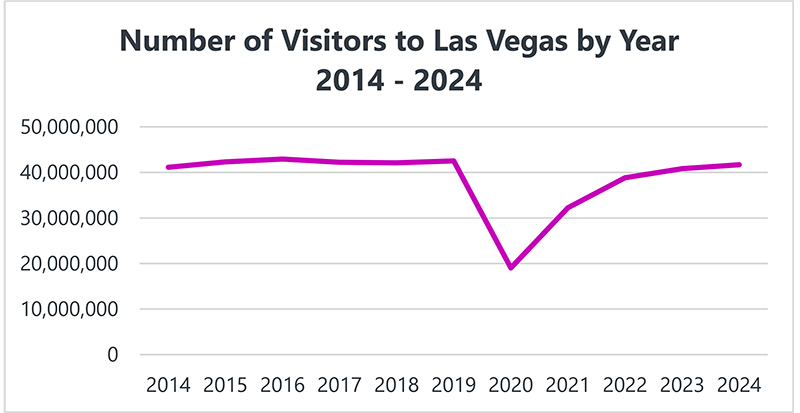
Here are the visitor growth statistics over the past 10 years:
- 2024: 41,676,300 (+2.07%)
- 2023: 40,829,900 (+5.15%)
- 2022: 38,829,300 (+20.47%)
- 2021: 32,230,600 (69.36%)
- 2020: 19,031,003 (-55.25%)
- 2019: 42,524,000 (0.97%)
- 2018: 42,116,900 (-0.23%)
- 2017: 42,214,100 (-1.68%)
- 2016: 42,936,100 (1.47%)
- 2015: 42,312,216 (2.88%)
- 2014: 41,126,512
Source: LVCVA
Is Tourism Up Or Down?
Tourism to Las Vegas has been increasing year-over-year since the end of the pandemic, but it has not yet returned to pre-pandemic levels.
For instance, in 2019, before COVID-19 hit, visitor volume was 42,524,000. Comparing that to 2024’s data, we’re still about 848,000 short.
My analysis below indicates that the deficit is primarily due to the slower recovery of convention attendance and international tourism.
However, these sectors are strengthening, providing optimism for a complete recovery sooner rather than later.
Convention Attendance
In 2024, Las Vegas hosted 5,994,800 convention attendees, up .14% from 2023.
However, this number is still 654,300 travelers short of the pre-pandemic high of 6,649,100 in 2019.
If we look at 2025, convention attendance from January to June is up by 46,400 as compared to the same period in 2024.
Some of that increase, though, is due to some shows changing dates.
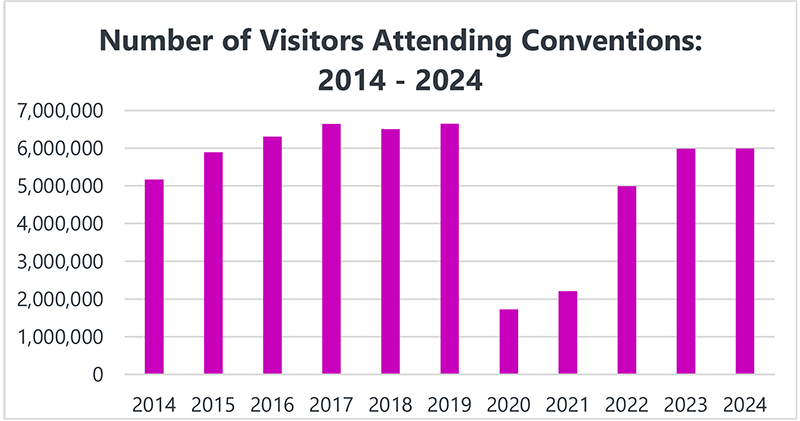
Convention Attendance: 10 Year Growth Statistics
- 2024: 5,994,800 (+.14%)
- 2023: 5,986,700 (+19.94%)
- 2022: 4,991,500 (+126.23%)
- 2021: 2,206,400 (+27.74%)
- 2020: 1,727,200 (-74.02%)
- 2019: 6,649,100 (+2.27%)
- 2018: 6,501,800 (-2.17%)
- 2017: 6,646,200 (+5.32%)
- 2016: 6,310,600 (+7.12%)
- 2015: 5,891,151 (+13.41%)
- 2014: 5,194,580
Source: LVCVA
International vs Domestic
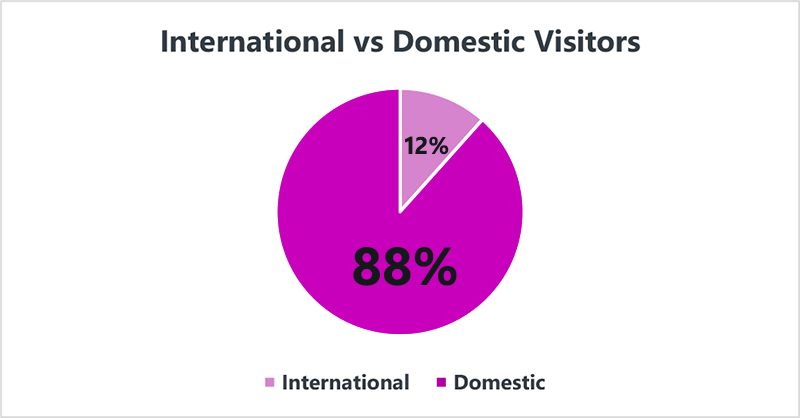
According to Tourism Economics data models, the estimated number of international tourists in 2024 was 5,023,500, accounting for 12% of the total.
Based on this, domestic visitation was 36,652,800, representing 88% of the total number of visitors.
It’s worth noting that since the end of COVID-19, domestic tourism has recovered faster than international.
In 2021, Las Vegas experienced a significant 72.88% increase in domestic travel, while international travel only increased by 14.5%.
However, international tourism surged in 2022, with a 162.3% increase and a 39% rise in 2023.
Sources: LVCVA, Tourism Economics
Which Countries Visit The Most?
In 2024, more than half (52%) of all international travel to Las Vegas came from Canada and Mexico.
Canadian visitors jumped from 1,398,300 to 1,423,300, a 1.8% increase over 2023. In comparison, the number of tourists from Mexico grew from 1,035,800 to 1,191,800, a 15.1% rise.
2024 was also a significant time for overseas travelers, with an increase of 10.5% over 2023.
Top 10 countries by Visitor Counts & YoY % Change (2024)
- Canada: 1,423,300 (1.8%)
- Mexico: 1,191,800 (15.1%)
- United Kingdom: 554,000 (+3.4%)
- Australia: 285,800 (+11.1%)
- Germany: 190,400 (+8.2%)
- South Korea: 171,400 (+13.3%)
- Brazil: 134,000 (+8.3%)
- Japan: 114,900 (+17.2%)
- China: 95,400 (+54.4%)
- France: 85,700 (+11.6%)
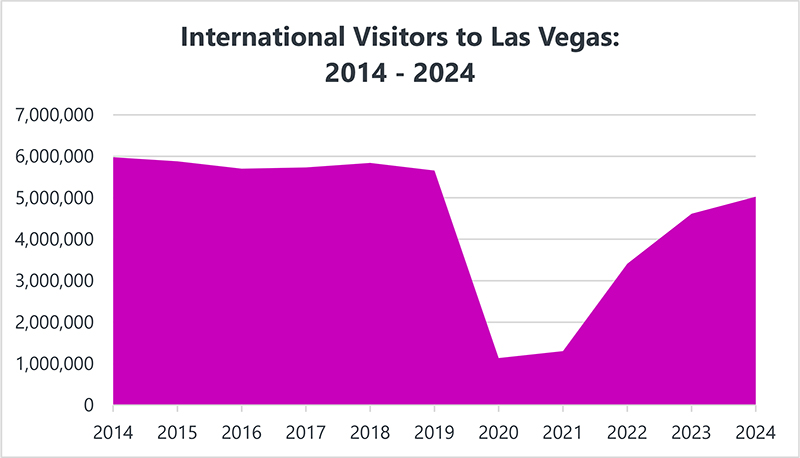
Despite the recovery, international travelers are still below pre-pandemic levels, with 633,500 fewer tourists than in 2019.
This graph visually puts it into perspective:
Source: LVCVA
Domestic Travel
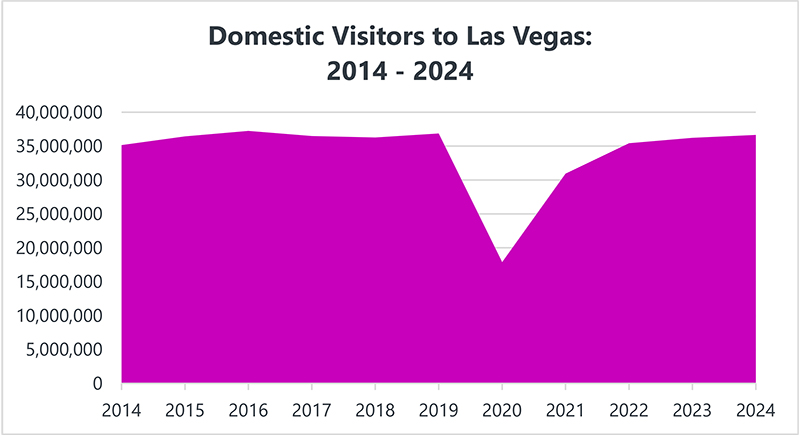
The number of US visitors to Las Vegas increased to 36,652,800 in 2024, a 1.21% rise from 2023.
Despite the positive growth, domestic tourism still lags by 214,200 tourists compared to 2019 and falls short of the 2016 all-time high by 583,300 people.
The chart below illustrates the relatively quick recovery of US-based tourism since the pandemic, which has outpaced international travel.
Which US Cities Visit Vegas The Most?
Below are the most recent statistics for the top 10 air feeder markets to Las Vegas by city.
It’s important to note that Los Angeles, San Francisco, New York, Chicago, Dallas, Seattle, Houston, and Washington D.C. include multiple airports.
For instance, San Francisco includes Oakland, San Francisco, and San Jose.
Given their proximity to Las Vegas and large populations, it’s no surprise that Los Angeles and San Francisco are the top two origin markets.
Top 10 US Metro Areas to Las Vegas by Air: Arriving Passengers
- Los Angeles Area: 1,803,764
- San Francisco Area: 1,416,637
- New York Area: 903,406
- Chicago Area: 809,767
- Dallas Area: 757,765
- Seattle Area: 725,669
- Denver: 624,097
- Houston Area: 555,107
- San Diego: 510,800
- Washington D.C. Area: 489,367
While the most recent air feeder data available is from 2024, the rankings for 2025 are likely unchanged due to these markets’ supporting populations.
However, as domestic tourism volume is decreasing in 2025, the passenger numbers for most metro areas are likely lower than what is shown here.
Source: LVCVA
What State Travels To Vegas The Most?
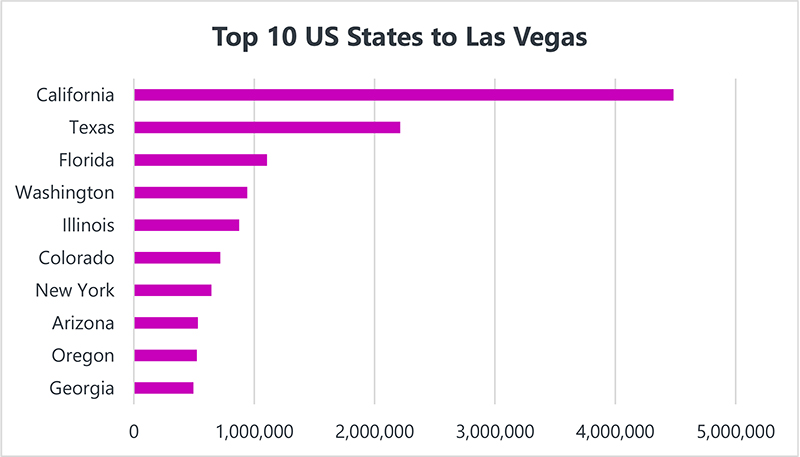
California is the state that travels to Las Vegas the most, with 4.48 million arriving passengers and 528,859 cars crossing the I-15 NV/CA border in 2024.
The chart below shows the top 10 states with the highest number of visitors, considering all airports within each state.
Florida is notable for its third-place finish, as none of its airports made the top 10 list in the air feeder markets by city.
Harry Reid Airport Passenger Statistics
Harry Reid International Airport experienced a record-breaking year for air travel in 2024, with 58,416,715 arriving and departing passengers.
This surpassed the previous record of 57,646,945 in 2023, representing a 1.34% increase.
But from January through June of 2025, the airport has already seen a 9.04% decrease, equivalent to 1,194,947 fewer passengers, compared to the same period in 2024.
Number of Passengers by Year & YoY % Change
- 2024: 58,416,715 (+1.34%)
- 2023: 57,646,860 (+9.45%)
- 2022: 52,667,741 (+32.63%)
- 2021: 39,710,493 (+78.86%)
- 2020: 22,201,479 (-56.92%)
- 2019: 51,537,638 (+3.81%)
- 2018: 49,646,118 (+2.51%)
- 2017: 48,430,118 (+2.10%)
- 2016: 47,435,027 (+4.67%)
- 2015: 45,318,788 (+5.67%)
- 2014: 42,885,350
Source: LVCVA
Las Vegas Tourism FAQs
Below are some of the most frequently asked questions about Las Vegas tourism numbers.
How Many Tourists Does Vegas Have Every Day?
Las Vegas receives an average of 114,181 visitors per day. This figure is calculated by dividing the total annual number of visitors in 2024 (41,676,300) by 365 days.
So far, in 2025, the average daily volume has decreased to 108,634, representing a 7.3% drop over the same period last year.
This calculation is based on the total number of visitors during the first six months of 2025 divided by 180 days.
It’s important to note that visitor traffic fluctuates depending on the season, with fewer people in town during the winter.
What’s The Average Number Of People Per Month?
In 2024, the average number of visitors per month in Las Vegas was 3,473,025, calculated by dividing the total number of visitors (41,676,300) by 12.
In comparing the first six months of 2025 to the same timeframe last year, the average monthly visitor volume has decreased to 3,259,016 from 3,515,100.
Which Month Is The Busiest?
I looked at the monthly visitor volume over the last ten years and found that historically, the busiest months in Las Vegas are October and July (tied for first), followed by March and then May.
These same months were also the busiest in 2024, albeit with a slight reshuffling. Last year, March took the lead, followed by May and October.
Visitor Numbers By Month (2024):
- January: 3,383,500
- February: 3,374,300
- March: 3,671,500 (1st)
- April: 3,513,500
- May: 3,657,200 (2nd)
- June: 3,490,600
- July: 3,512,500
- August: 3,399,900
- September: 3,389,100
- October: 3,564,800 (3rd)
- November: 3,313,700
- December: 3,405,700
Source: LVCVA
What Is The Slowest Month In Las Vegas?
February is consistently the slowest month in Las Vegas, with January coming in a close second, followed by December.
However, in 2024, November was the slowest, with almost 10% fewer people than March, which again had the highest number of travelers for the year.
To put this percentage into perspective, November was 357,800 tourists short of the busiest month.
Final Thoughts
Although Las Vegas is still below its pre-pandemic tourism numbers, the area is trying to recover.
International volume has increased over the past two years, and more business conventions are coming to town.
The city is also constantly in a state of reinvention, adding new attractions, entertainment venues, and sporting events that bring back tourists and attract new ones.
The incredible 2024 record-breaking year of air travel at Harry Reid International Airport is a testament to Las Vegas’ resiliency.